
When a ewe is being genetically evaluated for her maternal traits, the number of lambs produced reflects her prolificacy and this is reflected in her Number of Lambs Born (NLB) Sub Index.
NLB is reflected in her overall Replacement Index and accounts for 19% of the Replacement Index. This trait is very important to farmers when selecting their replacement ewes for breeding.
What does this mean for a commercial production system?
Peadar Kearney is a commercial farmer based in Dundalk, Co. Louth. Peadar is sheep farming the same land as many generations before him, and for the past 22 years on his own. The flock consists of mainly Blue faced Leicester, Texel and Suffolk cross ewes, with 215 breeding ewes due to lamb down this spring. Peadar scanned his ewes in December 2023, and the results of this scan show that his 5 star Replacement ewes are producing more lambs than his 1 star ewes. The below graph is comparing the results of 215 ewes scanned (See figure 1 below).
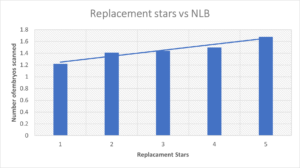
On average his 5 star ewes are producing 0.46 more lambs than their 1 star counterparts, equaling to nearly half a lamb more on the ground. His average 5 star ewe is producing 0.26 more lambs than his flock average (that’s another 25 lambs per 100 ewes). Peadar noted, “In previous years I chose my replacement ewes based on growth rate, looking at this year’s scanning results and the massive difference between the one stars versus four or five stars, it’ll be a deciding factor going forward for keeping ewes”.
In this second graph we take a look at the average ewe Replacement Index for barren, singles, twins and triplets respectively in Peadar’s flock. This measurement has greater accuracy than the replacement stars alone as this figure compares across breeds.
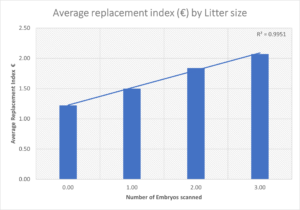
In the above graph it can be seen that the Replacement Index is highly correlated with the number of embryos scanned. Correlation refers to the relationship between two variable traits, in this case the average number of lambs scanned and the average Replacement Index of each ewe.
Ewes with higher Economic Breeding Values (EBV) in the Replacement Index are proving to be making more profit at farm level. Commercial farmers will benefit in profit by choosing a high Replacement Indexed ram and should consider seeking rams with high EBV’s when selecting rams for purchase.
Keeping their breeding policy in mind, if farmers wish to breed both replacement ewe lambs and lambs for slaughter, then a high Replacement Index ram should be purchased. The € value of the Replacement Index is across breed, comparing every breed of ram to each other and represents the difference in profit produced by each lamb sired by that ram.
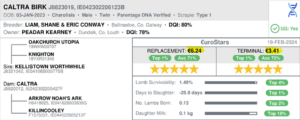
The Replacement Index € value is displayed on sale catalogues and on Ram Search in the €urostars section. The Euro-Star Indexes are designed to aid sheep farmers in the selection of more profitable breeding animals.
This valuable tool assesses the genetic component of an animal’s performance across all traits of importance for Irish sheep farmers.
To learn more about the €urostar Indexes and Traits click on the below image!