Once you access you Farmer Homepage, genomic results from genotyped animals are displayed in the Genomic Results report screen. Parentage results, Scrapie type, and the Inbreeding Coefficient %, are displayed in three different tabs.
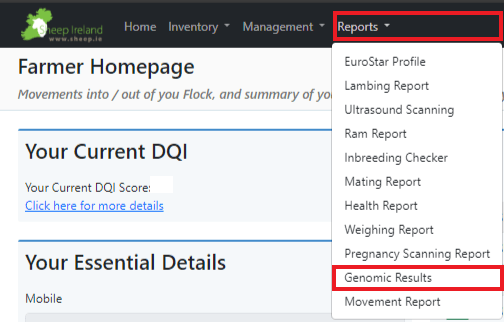
Parentage Results
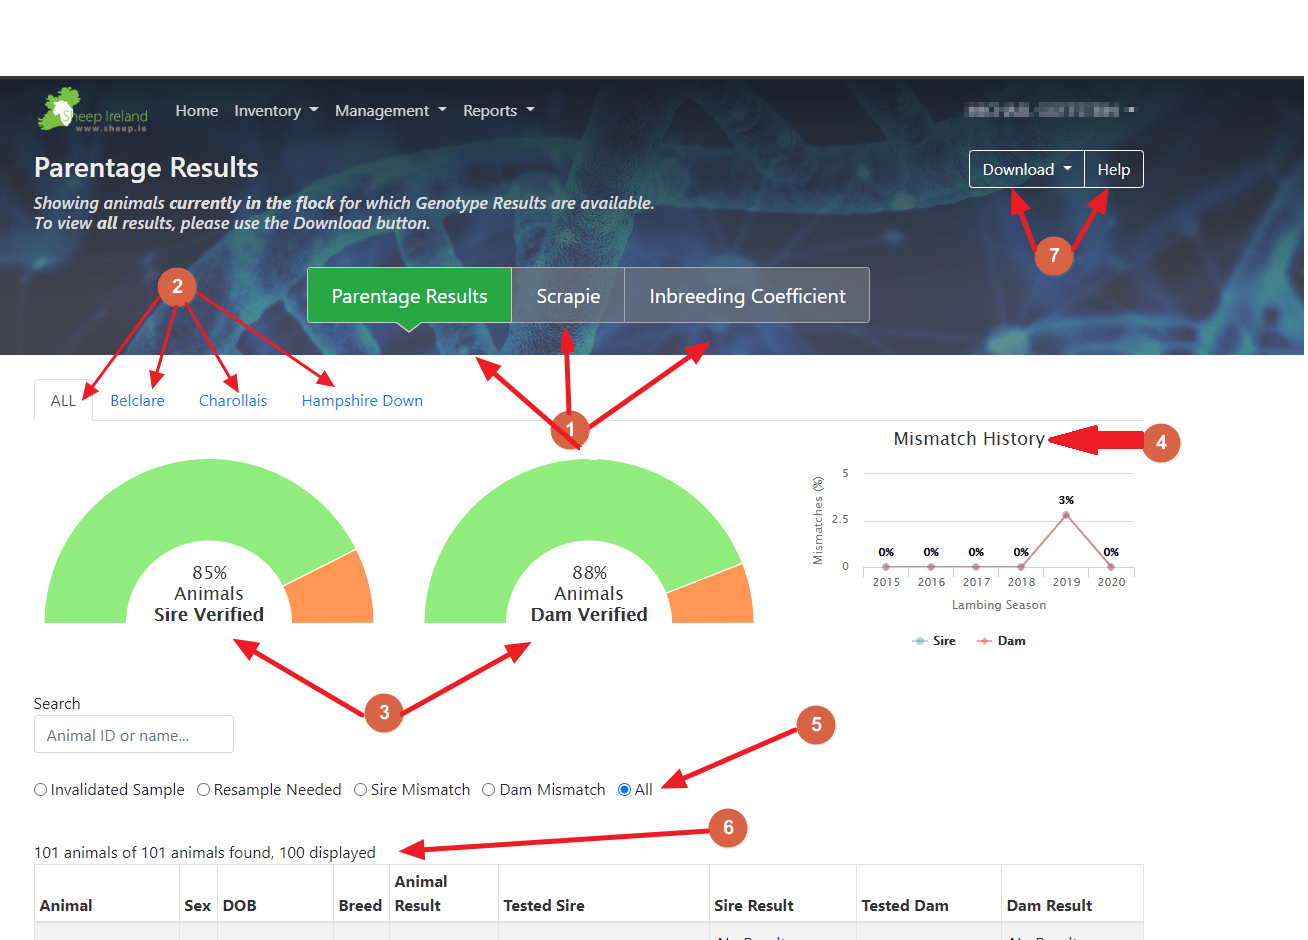
Select between: Parentage Results / Scrapie Results / Inbreeding Coefficient Results – when entering the genomic results screen, by default you will see your parentage results screen, and you can select the ‘Scrapie’ tab and ‘Inbreeding Coefficient’ separately to view those results.
In the Parentage Results screen, you can analyse if the animals you have genotyped in your flocks were done so successfully and if and where any issues arose with your DNA samples, those issues will appear here. Where animals have successfully been genotyped and verified to parents these will appear here also. Select breed – by default the parentage results screen displays all genotyped animals in your flock. You can then select per breed to get the number of animals that are sire verified and dam verified for that breed.
Percentage of animals sire and dam verified – these pie graphs display the number of genotyped animals in your flocks that have been DNA verified to a sire and DNA verified to a dam. Using your mouse to hover over each segment (green – verified, orange – not verified) the percentage and number of animals who have been verified will appear. For example, 86 genotyped animals of 101 (85%) genotyped animals in your flock are sire verified, and 89 of 101 animals (88%) of your genotyped animals are dam verified. When selecting per breed, these figures and percentages will reflect sire and dam verified animals per breed.
Mismatch history – this graph displays the number and percentages of sire and dam mismatches over several lambing seasons. Again, this mismatch graph populates the over flock history by default and using the breed tabs, the graph populates mismatches per breed. You can hover over the lines in the graph and the number of mismatches will appear relative to the number of animals genotyped in the flock.
Filter buttons – here you filter to get a list of animals with a particular result. For example, if ‘resample needed’ is selected, all the animals in the flock that had DNA samples taken and the lab could not process or get a satisfactory genotype result, the lab will report that this animal’s results is ‘resample needed’.
Display table – by default the display table will display up to 100 genomic results of all animals currently in your flock that were genotyped. The header of each of these columns are filterable. For example, if you click on the ‘DOB’ header, this will sort the results based from youngest to oldest or vice versa if you can’t visualize all animals.
Download and Help buttons – When you click on the ‘Download’ button this will give you the option to download the animals currently in your flock for which you have genomic results for, and ‘all animals’ which will download the results for all animals that you have ever genotyped. Clicking on the ‘help’ button will bring you to an information page with some explanations and frequently asked questions to guide and support you through your genomic results.
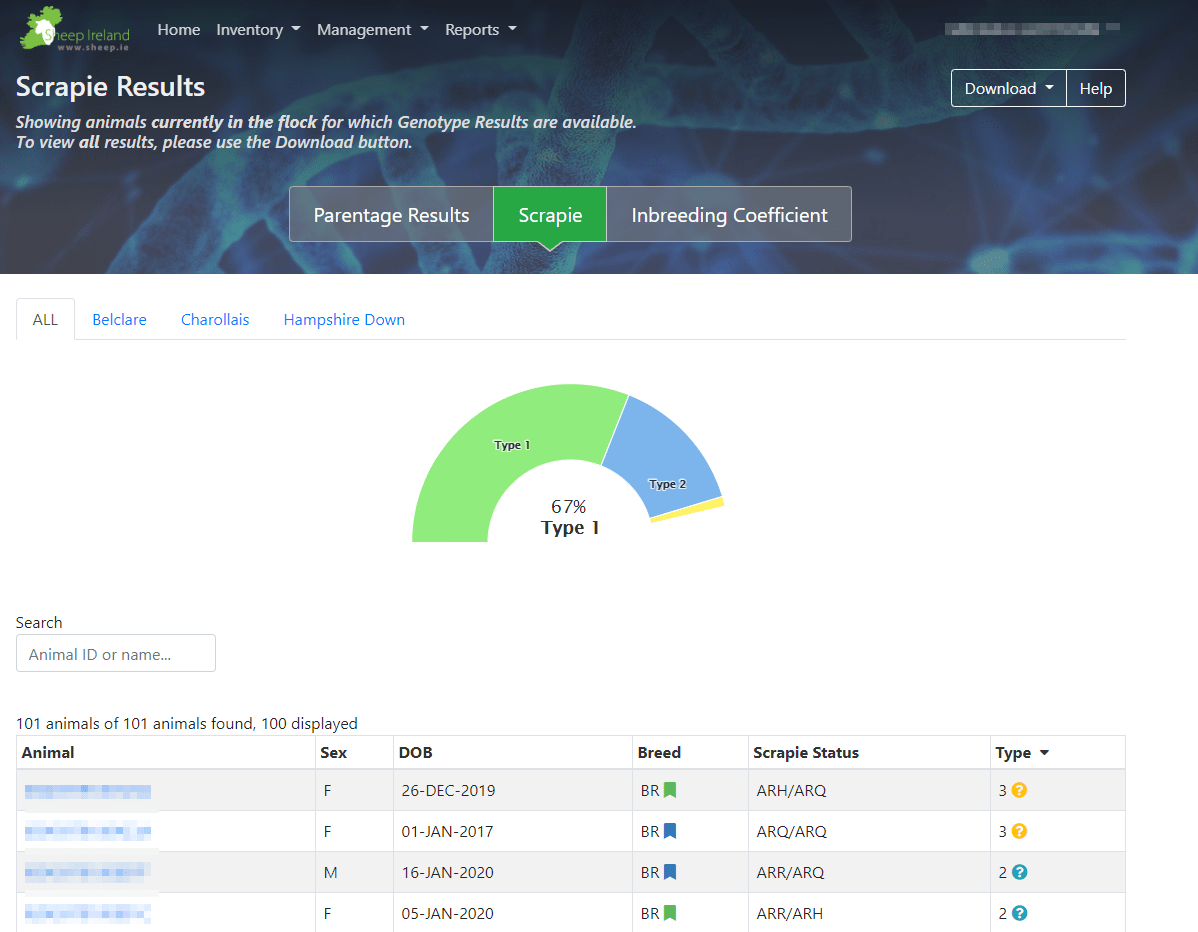
Scrapie Results
On the Scrapie results screen, any genotyped animals in the flock with an available scrapie type will appear here. Similar to the parentage screen, you can select per breed and the pie graph displayed will update to reflect the scrapie results.
The pie graph illustrates the number of animals by their scrapie type and you can hover over each coloured segment to find the number and percentage of animals per type. In your table, the animals are displayed with the highest scrapie type by default.
Similar to the parentage screen, the header columns are filterable thus sorting the list to your choice. While the scrapie type is displayed in the graph, the scrapie status can be found in the table of animals.
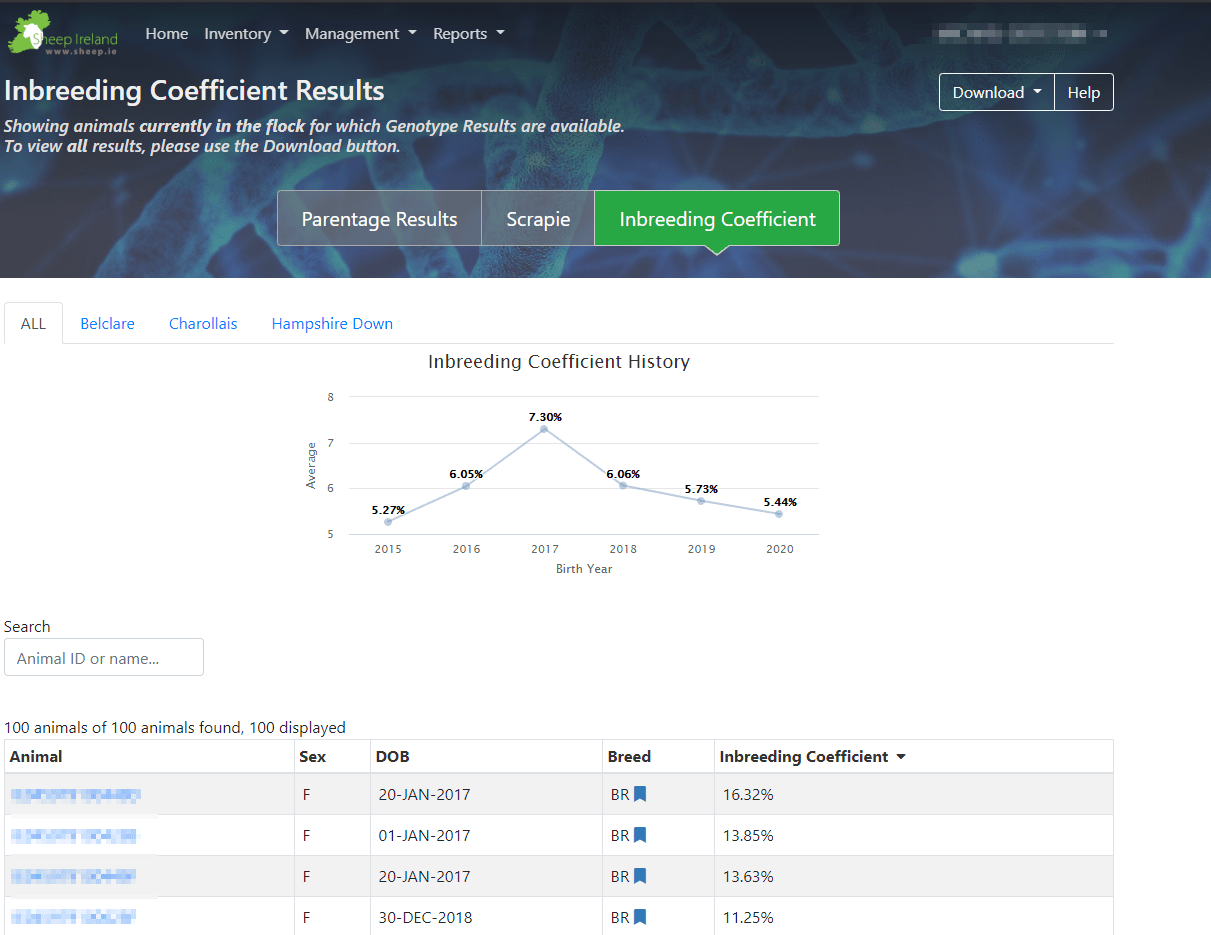
Inbreeding Coefficient Results
On the inbreeding coefficient results screen, the genotyped animals for which an inbreeding coefficient is available will be displayed here. On the graph the average inbreeding coefficient percentage per birth year of animals is displayed.
The average inbreeding coefficient across the flock is displayed by default under ‘all’ and similar to the parentage and scrapie results screens you can select per breed and this graph will populate for each breed of sheep in the flock. Again, similar to the parentage and scrapie results screens, the header columns are filterable thus sorting the list to your choice.
For more information on the inbreeding coefficient screen go to the ‘help’ button on the genomic results screen.