Many breeders have asked us what data they need to be recording and when, as well as, how to distinguish between the different scores when recording traits such as lambing difficulty.
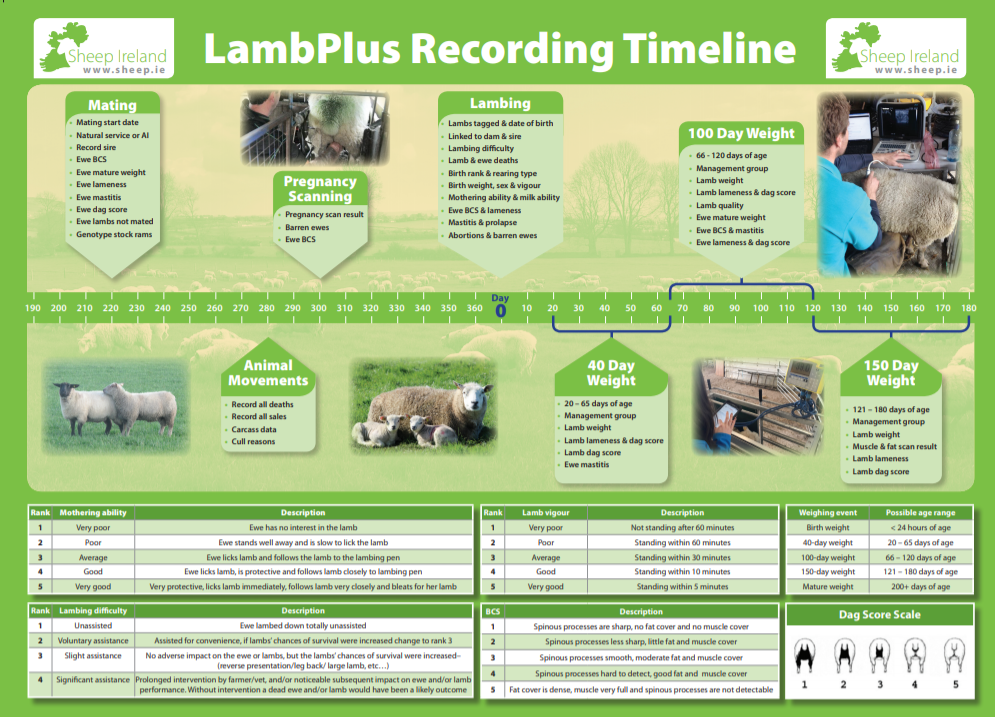
LambPlus breeders all receive a timeline wall chart when signed up to LambPlus. This wall chart will provide a clear description of what data needs to be recorded, when it needs to be recorded and how to record it correctly.
The wall chart should be to hand when you are recording data so maybe the best place for it is in the lambing shed, beside your handling unit or next to your computer. We hope the wallchart will be a aid to recording data accurately.

The timeline is based around the 365-day production cycle starting at day 0, which is the day of lambing. All the data to be recorded at lambing is listed and a description of how to record certain traits is included at the bottom of the wall chart.
For example, when recording lambing difficulty, it can be difficult for a breeder to distinguish between a lambing difficulty score of 2 and 3 but this wall chart provides a detailed description of each score which will make data recording easier. The timeline also gives the acceptable ranges for date specific traits such as 40-day, 100-day and 150-day weights. As well as this, the other data that needs to be recorded at each of these time points is outlined.

Data recording at lambing and while the lamb is growing is critically important, but the timeline wallchart also reminds you of the data that needs to be recorded from mating to lambing.
The LambPlus recording timeline will help you to record your flock’s data correctly, accurately and in a timely fashion which will all help to improve your DQI, index accuracies and your overall flock performance.

